For our recent Innovation Week, I wanted to explore how to build generative data visualizations using the new MCP Apps extensions1. Previously I explored agentic chat applications (053) and dynamic MCP tools (057), but this lab focuses on UI: giving LLM chat clients a first-class chart surface that can be rendered on demand. In short: MCP Apps let a chat assistant open real UI inside the chat, not just print text or JSON.
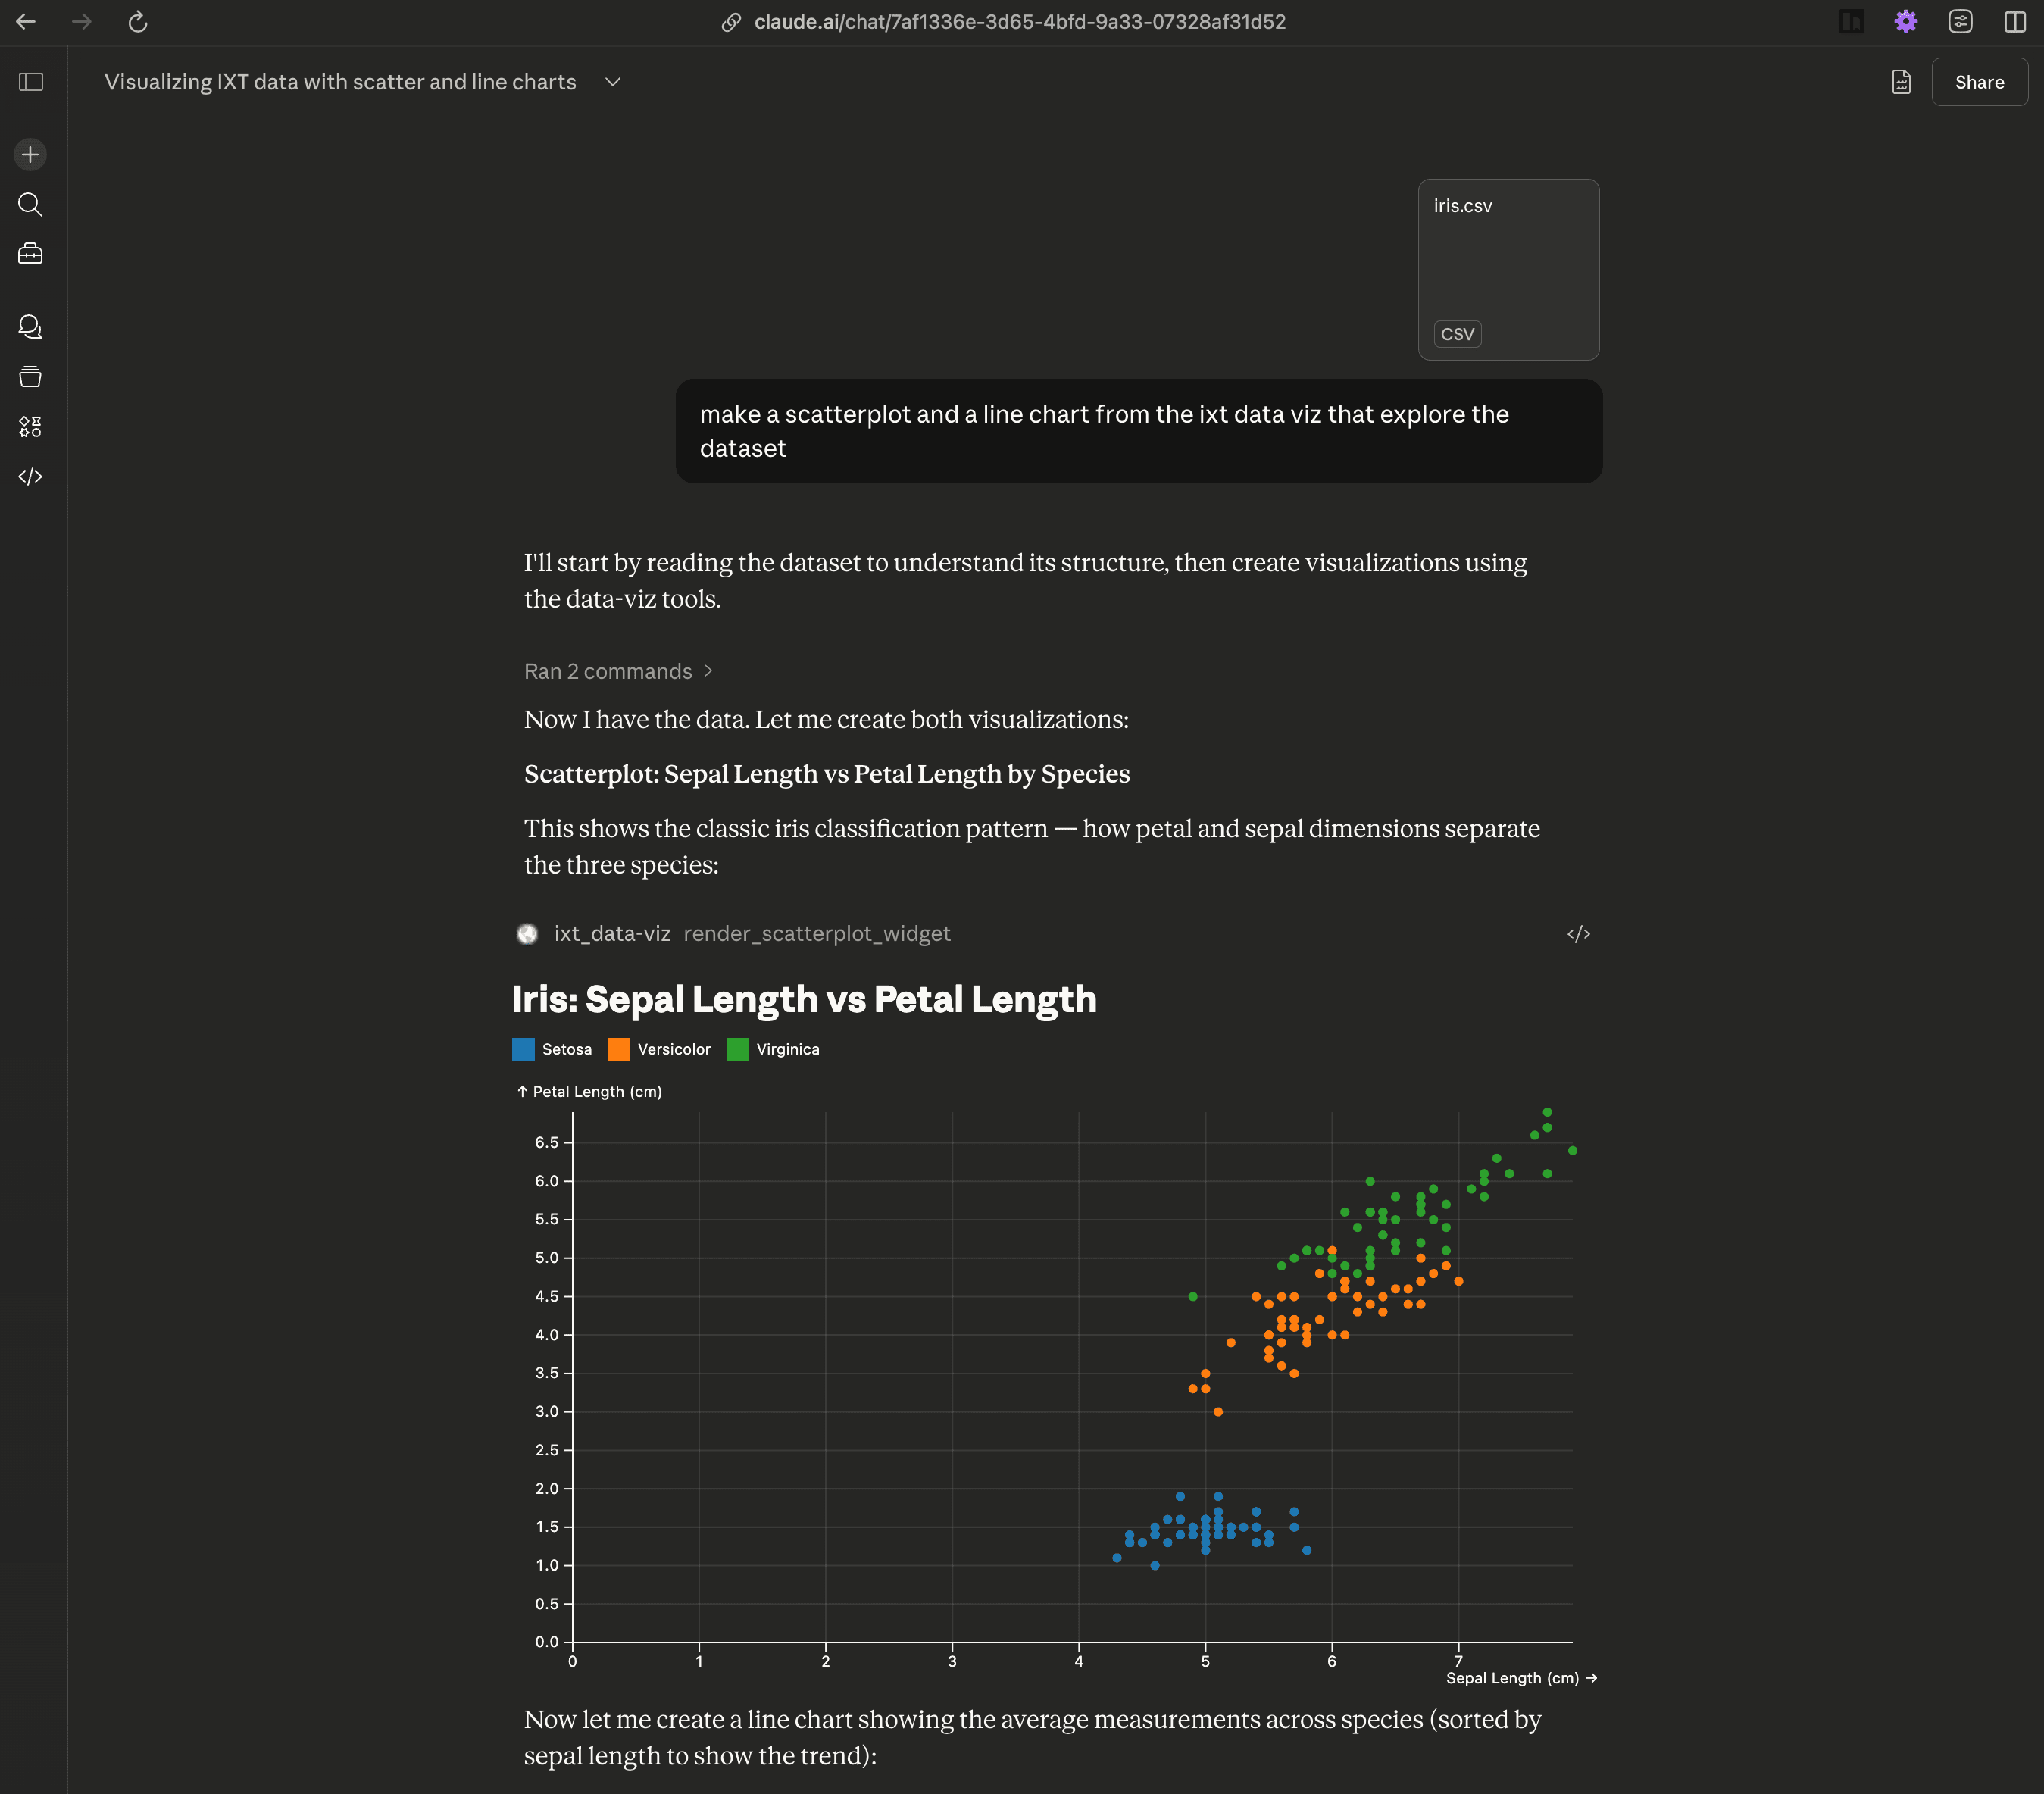
Give it a try with any MCP Apps-capable chat client. I used Claude.ai for testing. TL;DR: connect the MCP URL, upload data, ask for a chart.
-
Customize → Connectors → [+]
-
Add this MCP URL:
https://lab-dataviz-mcp-server-mcp-516447198205.europe-west6.run.app/mcp -
Enable the connector in chat
-
Upload a CSV (or ask for mocked data)
-
Ask for a bar chart, line chart, or scatterplot
What is an MCP App?
Before MCP Apps, UI in chat meant stuffing a chart spec into markdown and hoping the client knew how to render it. MCP Apps standardize that: the server declares a UI resource (HTML) and a render tool (schema + ui.resourceUri), and the client mounts the UI when the tool is used.
Separation of concerns:
- Chat Client (browser UI): owns UX + theming, mounts the view, and streams UI events back to the host.
- Chat Server (LLM + tool loop): chooses tools and executes calls against MCP servers.
- MCP Server (this lab): hosts UI HTML + tool contracts for widgets.
This split keeps UI portable: swap clients or servers without rewriting widgets.
The widget code runs in the chat client, but it's served by the MCP server. The host bridges UI resources and tool results, so you can swap servers or clients without rewiring the UI.
The LLM sits inside the chat client's tool loop. In practice, the model reasons over the tool schema, not the UI. So good descriptions and sensible defaults guide the chart more than extra prompting. When users interact with the view, the app can send ui/message (add a chat message) or ui/update-model-context (update context for the next turn) back to the host, which is what feeds the model.
Note: if the view is mounted during execution, the host can stream results with ui/notifications/tool-result (and partial input via ui/notifications/tool-input-partial).
What I Built
For the lab, I used my bEvr monorepo template2 to build a simple MCP server and three Plot-based widgets: bar chart, line chart, and scatterplot. The server exposes each widget as a UI resource and a render tool, and the widgets connect to the host for theming and event streaming.
- Widgets: bar chart, line chart, scatterplot (Plot + React)
- Server-mcp: MCP Apps resources + render tools
- Theming: host CSS variables injected into widgets
Repo overview:
.
├── apps/
│   └── server-mcp/         # MCP Apps server (Effect + @effect/ai)
└── packages/
    ├── widget-bar-chart/
    ├── widget-line-chart/
    └── widget-scatterplot/
MCP Server Wiring
With the help of some helpers, wiring up a widget looks like this: define a UI resource with the widget HTML and metadata, then define a render tool that points to that resource and carries the payload schema.
const BarChartWidgetResourceLayer = makeUiResource(
  "ui://bar-chart",
  {
    name: "Bar Chart",
    description: "Bar chart widget UI",
    html: BarChartWidgetHtml,
    meta: { prefersBorder: false },
  },
);

export const RenderBarChartWidgetTool = makeUiRenderTool(
  "ui://bar-chart",
  {
    name: "render_bar_chart_widget",
    title: "Bar Chart",
    description: "Render the bar chart widget UI",
    parameters: BarChartWidgetPayload,
    success: BarChartWidgetPayload,
  },
);
The resource returns HTML with a text/html;profile=mcp-app mime type, and the render tool carries a ui.resourceUri annotation so chat clients know what to mount.
The real context engineering work lives in the tool schema and annotations. I use Schema to define the payload shape and Tool.annotate (via helpers) to add UI metadata like the title and resource URI. The model only sees this contract, so good descriptions and sensible defaults matter more than prompt engineering.
The trade-off is context size vs. fidelity. Rich schemas help the model compose better charts, but they also expand context. I found that using one-shot examples in the schema annotations helped guide the model without needing extra prompting. Here is a slimmed-down version of the payload schema to show the shape the model sees (with annotate metadata + examples):
export const BarDatum = Schema.Record(Schema.String, Schema.Union([
  Schema.String,
  Schema.Number,
  Schema.Boolean,
  Schema.Date,
  Schema.Null,
])).annotate({
  description:
    "Single bar data object. Keys are column names used by marks.x and marks.y.",
  examples: [{ category: "Q1", value: 120 }],
});

export const BarChartWidgetPayload = Schema.Struct({
  data: Schema.Array(BarDatum).annotate({
    description:
      "Array of bar data objects. Each object must expose the keys used in marks.x and marks.y.",
  }),
  direction: Schema.Literals(["horizontal", "vertical"]).annotate({
    description:
      "Orientation of bars. Vertical defaults to x=category and y=value; horizontal swaps them.",
  }),
  layout: Schema.Struct({
    title: Schema.String,
    width: Schema.Number,
    height: Schema.Number,
  }).annotate({ description: "Plot layout options. All fields optional." }),
  marks: Schema.Struct({
    x: Schema.String,
    y: Schema.String,
  }).annotate({
    description:
      "Mark channel mapping. Use marks.x and marks.y to select data keys.",
  }),
}).annotate({
  description:
    "Payload for render_bar_chart_widget. Choose marks.x and marks.y to match keys in data objects.",
});
Widget Anatomy
For the widgets themselves, I kept things simple with React and used the @modelcontextprotocol/ext-apps/react library to help wire the apps together. Then using Vite's vite-plugin-singlefile plugin, I built each widget into a single HTML file that can be served as a UI resource.
Each widget follows a similar lifecycle: decode payload → debounce tool results → connect to host → apply host styles → guard connection/errors → render Plot chart. Here's the core pattern from the WidgetApp:
export const WidgetApp = () => {
  const [payload, setPayload] = useState<
    typeof BarChartWidgetPayload.Type | null
  >(null);
  const lastPayloadRef = useRef<string | null>(null);

  const updatePayload = (next: typeof BarChartWidgetPayload.Type) => {
    const serialized = JSON.stringify(next);
    if (lastPayloadRef.current === serialized) return;
    lastPayloadRef.current = serialized;
    setPayload(next);
  };

  const { app, isConnected, error } = useApp({
    appInfo: { name: "widget-bar-chart", version: "0.1.0" },
    capabilities: {},
    onAppCreated: (app) => {
      app.ontoolresult = (params) => {
        const parsed = Schema.decodeUnknownSync(BarChartWidgetPayload)(params);
        if (parsed) updatePayload(parsed);
      };
    },
  });

  useHostStyles(app, app?.getHostContext());

  if (error) return <div>Error: {error.message}</div>;
  if (!isConnected) return <div>Connecting…</div>;
  if (!payload) return <div>Waiting for data…</div>;

  return <BarChart {...payload} app={app} />;
};
The key details:
useAppwires the MCP App lifecycle and tool results.useHostStylesinjects theme variables from the host.- Payloads are encoded and decoded with
Schemato ensure the model gets a tight contract and to guard against malformed input.
Plot Rendering + Responsiveness
The actual Plot rendering happens in a small useEffect. I also use ResizeObserver to push size updates back to the host for responsive layouts.
const plot = Plot.plot({
  style: "--plot-background: var(--color-background-primary);",
  ...layoutOptions,
  ...(width ? { width } : {}),
  color: {
    ...(layoutOptions.color ? layoutOptions.color : {}),
    scheme: "Category10",
  },
  marks: [
    isHorizontal ? Plot.ruleX([0]) : Plot.ruleY([0]),
    isHorizontal ? Plot.barX(data, barOptions) : Plot.barY(data, barOptions),
  ].filter(Boolean),
});

containerRef.current.replaceChildren(plot);
And for size changes:
const observer = new ResizeObserver((entries) => {
  const entry = entries[0];
  if (!entry) return;
  const nextWidth = Math.floor(entry.contentRect.width);
  if (Number.isFinite(nextWidth) && nextWidth > 0) {
    setMeasuredWidth(nextWidth);
  }
  if (!app) return;
  // debounce + sendSizeChanged to host
});
All in all, the widgets are around ~200 lines of code each, with most of the logic around payload handling and host communication. The Plot rendering itself is pretty straightforward once the data is in place.
Not all smooth sailing
The final result is pretty slick, but there were some bumps along the way:
- ChatGPT Apps SDK: I tried to support the Apps SDK variant, but ChatGPT didn't detect the UI resource and rendered the tool output as text.
- Context size: the combined tool schemas add ~8.2k tokens. Defaults are sensible, but I'll trim schema surface area next.
- Bundle size: the widgets are around ~1MB each, mostly from React. While this is fine for a demo, I'll explore Web Components to reduce this in the future.
I have a lot of ideas for improving the widgets and server, but I wanted to stop somewhere before this turned into a full project. The goal was to explore the potential of MCP Apps for generative data viz, and I think this lab shows that off well.
Lessons Learned
- MCP Apps make UI first-class. It's the missing layer between chat tools and real interaction.
- Schema reuse is a superpower. Sharing the payload schema between server + widget keeps the UI contract tight.
- Theming needs to be host-driven. CSS variables give you a real white-label surface without rebuilding components.
Conclusion
I learned a lot building this, and MCP Apps feel like the right layer for interactive, on-demand data viz in chat. I’ll keep iterating with more chart types and lighter-weight widgets, but the current repo is ready to explore and build on.